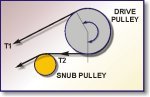
Figure 1: Typical Drive Pulley
Belt Tension Theory
Driving or slack side tension (T2)
To determine the minimum tension which must be introduced into the belt as it leaves the driving pulley, to ensure that the effective tension or power can be transmitted into the belt passing around the drive pulley, without slip.
Prior to going into this analysis, it is necessary to understand the effect that friction and wrap angle have on the driving characteristics of a pulley.
These are discussed below :-
(a) Friction Factors
The fundamental equation for conveyor drive calculations is: T1 / T2 = eθ
Where:
T1 and T2 are the tight and slack side tensions respectively.
e = 2,718
θ = angle of wrap in radians
= coefficient of friction between belt and drive pulleyThe tensions and angle of wrap are fairly tangible and are determined by the configuration of the machine and the loads on it. , however, is not well understood, difficult to measure and subject to wide variation with different materials and environmental conditions.
The following factors will determine the selected coefficient of friction :-
(i) Belting Material
The shore hardness, type of rubber and the age of the belt will have an effect on the coefficient of friction.
(ii) Drive Pulley Construction
This can be a bare steel pulley or it can be lagged to increase the coefficient of friction. The lagging can have different shore hardness, which changes the coefficient of friction. It can be grooved, which improves the coefficient of friction in certain wet conditions, but again it must be remembered that the coefficient will reduce in time because of the ageing of rubber and the blocking of the grooves in the rubber lagging, or due to wear on the lagging.
Click here to go to the pulley section where more information can be found on: Pulley types and Pulley lagging .
(iii) Working Conditions
The conditions under which the installation will operate, i.e. will conditions be dry or wet, and if wet, to what extent? What size and what type of material? Fine powdery material can reduce the coefficient of friction by acting as a lubricant between the pulley and the belting. If the material to be handled is oily, it will reduce the coefficient of friction drastically especially under wet conditions.
(iv) Design Conditions
The following design conditions will effect the coefficient of friction :-
Angle of wrap of the belt around the drive pulley.
The maximum tension to be transmitted via a drive pulley
The maximum face pressure between the belting and drive pulley. This will not only effect the coefficient of friction but will also limit the selection of the type of lagging for a pulley.

For example, in figure 2 above :-
Face pressure PF can be calculated as follows
Fn = 2T Sin dθ/2
PF = Fn/r d = T/r with dθ = 0where:
PF = face pressure kPa
r = pulley radius (mm)
Fn = force on pulley, kN/m
Tave = belt tension, kN/m
θ = angle of wrap, degrees.Extreme pace pressure would result in peeling and rolling away of the pulley cover / lagging, especially at the drive pulleys where there would be belt creep.
High tension steel cable belts are usually the only place where face pressures become a factor in lagging, pulley and drive selection.
Soft rubber lagging is not usually suitable for drives of more than 100 kW per pulley and slide-lagging is usually limited to drives of 400 kW per pulley, but the lagging thickness will have an obvious effect on this.
Diameter of pulleys must be selected to minimise the face pressure for rubber to 1 000 kPa.
Minimum Pulley Diameters: Fabric Belting or Steel Cord Belting
b) Drive Factors
Most references publish tables of drive factors for various values of and this tends to obscure the fact that is faily arbitrarily chosen.
The drive factor, 'Cw' is defined as
Cw = 1 / eθ - 1
and
T2 = Cw Belt Power (kw) / Belt Speed (m/s)
T1 T2 = Te
and
T2 = CwTe
The use of drive factors is to be discouraged. Designers are urged to select carefully for each application.
Values of published by various authorities are shown in Table 1 below:
Table 1: Typical Friction Factors for Drive Pulleys
| CONDITION | CEMA | STEVENS ADAMSON |
BRIDGESTONE | LINATEX | REMA TIP TOP |
| Bare Pulley | 0.25 | 0.35 | 0.1 - 0.3 | -- | -- |
| Lagged | 0.35 | 0.35 | -- | -- | -- |
| Dry Lagged | 0.35 | 0.35 | 0.35 | 0.6 | 0.4 - 0.45 |
| Wet Lagged | 0.35 | 0.35 | 0.2 - 0.3 | 0.8 | 0.35 |
| Wet and Dirty Lagged | 0.35 | 0.35 | 0.2 | 0.4 | 0.25 - 0.3 |
These values are the limiting conditions (when the belt is on the point of slipping). The actual coefficients of friction developed between surfaces are, in practically all cases where slipping does not occur, in excess of those shown above.
Therefore, the convention of using these values, whilst convenient, does not reflect what exactly occurs at the drive.
With a working drive, the higher tensioned part of the belt is stretched more than the lower tensioned section, thus the belt entering the positive drive will be travelling faster when it leaves it. (In a regenerative drive the opposite is true).
The elastic recovery of the belt occurs over only a part of the total angle of contact and it is at this point, (where creep takes place), that all the driving is done, while making full use of the coefficient of friction.
It is only over this 'active part' of the wrap angle (See fig. 4 below) that the classical tension formula can be applied, because this is where the limiting condition occurs. This is an approximate solution as it varies with both creep and angle of wrap.
A typical graph of '' against creep rate is shown below in Figure 3.

Figure 4 shows the drive conditions where the 'passive' arc is between 'A' and 'B' and all the drive is transmitted between 'B' and 'C' which is called the 'active arc', with '' being dependant on creep rate.

By maintaining a constant T2 and increasing T1 the active arc will increase, until it uses the whole of the wrap angle. A further increase in T1 will cause slipping and a reduction in the power transmitted. To realise the importance of the variations in '' consider the following:
Comparing =0,2 and 0,4 for θ=3,66 radians then;
T1/T2 = 0,27 and T1 / T2 = 4,32 respectively
i.e. for the same T1, T2 will have to be more than doubled to drive without slipping at = 0,2.
c) Rubber Specification
Except for Linatex, which is a special material, most references mention no particular rubber specification. Also, very little attempt is made to allow for conditions such as dust which must affect drive performance.
According to figures quoted by Bridgestone we should use = 0,2 for wet and dirty application instead of the conventional 0,35. This value applies only in the limiting case and the Bridgestone factors are very conservative. This has been verified by Stevens Adamson, who claim that the actual coefficient is likely to be in the range of 0,5 to 0,6 but 0,35 is used for safety and to allow for high starting torques. No distinction is made for chevron lagging as the grooves are for drainage only.
It is interesting that very little attention is paid to the actual rubber material with which the pulleys are lagged. The coefficient will vary with the hardness and type of rubber on the pulley and on the belt as well as with external, or environmental conditions.
The standard rubber lagging used has a hardness of 55 shore and this is supposed to be a good compromise between grip and long life. However some companies insist on a much harder material in the range of 65 to 70 for long life. Rema Tip Top use 65 to 70 for heavy duty drives but go down to 50 for lighter duties.
Softer, more cohesive rubbers are used, but there is a greater tendency for the rubber to shear internally and eventually pull off. Coefficients claimed for soft rubbers are shown in Table 2 below.
Table 2: Typical Values of for Soft Rubbers
| Shore Hardness | Dry | Wet | Wet and Dirty | |
| Rema Tip Top | 50 - 55 | 0.4 - 0.35 | 0.35 | 0.25 - 0.3 |
| Linatex | 60 | 0.6 | 0.8 | 0.4 |
The thicker Linatex lagging actually has a fabric layer in the rubber to prevent internal tearing from taking place. The conclusions which can be drawn from the above are:-
Published tables must be used with great care. Careful consideration must be given to the materials involved and the conditions under which the machinery will operate. It is not good enough merely to look up the 'drive factor' in your favourite catalogue i.e and then press on regardless.
Figures published by CEMA, Bridgestone, etc., are conservative and there is scope for intelligent use of higher factors to reduce belt tensions.
Materials such as Linatex are available which have a much higher value than the usually accepted values.
If too low a value is chosen for the conditions or the conditions are misinterpreted, drive/belt slippage may result and serious problems will occur.
Finally, table 3 lists the coefficient of friction which could be used for future designs. This table can be expanded to include Ceramics.
Table 3: Coefficient of friction - Drive Pulleys
| Plant Description | Conveyor Construction | Type of Take - Up's | |||
| Automatic | Manual | ||||
| Lagged | Un-Lagged | Lagged | Un-Lagged | ||
| Wet Plant | Covered Conveyor Uncovered Conveyor |
0.25 0.20 |
0.10 0.10 |
0.20 0.20 |
0.10 0.10 |
| Semi-Wet Plant | Covered Conveyor Uncovered Conveyor |
0.30 0.25 |
0.20 0.15 |
0.25 0.22 |
0.18 0.13 |
| Dry Plant | Covered Conveyor Uncovered Conveyor |
0.35 0.30 |
0.22 0.18 |
0.25 0.25 |
0.20 0.15 |
With an understanding of the factors effecting the slack side tension T2 it is now possible to continue.
Having calculated the driving or slack side tension from the above analysis.
The resulting tight side (maximum tension) (T1) in the belt at the drive pulley would be :-
T1 = TE + T2 (N).
Sag Tension (Ts)
In many instances the slack side tension as calculated above will be sufficient to ensure that adequate tension is retained at all points around the conveyor. However, in some cases, it is found that if the calculated T2 is used the belt tension at the tail end of the conveyor is not sufficient to support the loaded belt without undue sag between the idlers.
Under normal circumstances the sag between the idlers is restricted to 2 % of the idler spacing. The tension required (Ts) is dependent upon the mass of the loaded belt and the idler spacing and is given by the formula :
Ts = 3 x %sag / 100 x IS(carry) x (Wb + Wm) x 9,81 with units of (N)
Therefore it is necessary to carry out a check calculation, taking the tension required to limit sag to 2 % and comparing it to the tension to prevent belt slippage at the drive pulley. If the sag tension is found to be too low to support the load then the T2 tension and thus the tension distribution throughout the conveyor must be increased by the difference between the two tensions.
Maximum Belt Tension (T1)
To calculate the maximum belt tension, which does not in all cases takes place at the head pulley, the following formulae must be used :
TI = T2 + TE (N) or,
should Ts be greater than T2 then Ts must be used in place of T2
T1 = (T2 - Ts) + T2 + TE (N)
Belt Tensions/Strength: Fabric Belting or Steel Cord Belting
Unit Tension Conversion
To conclude, the total belt tension as calculated above is usually expressed as a unit tension for reference against various information tables. This is done by dividing the total calculated tension by the belt width.
Therefore Unit Tension = Belt tension (N) / Belt width (mm) giving units of N/mm width.
![]()